Confirm that Grafana is accessing data from InfluxDB
Step 1 - Login to Grafana
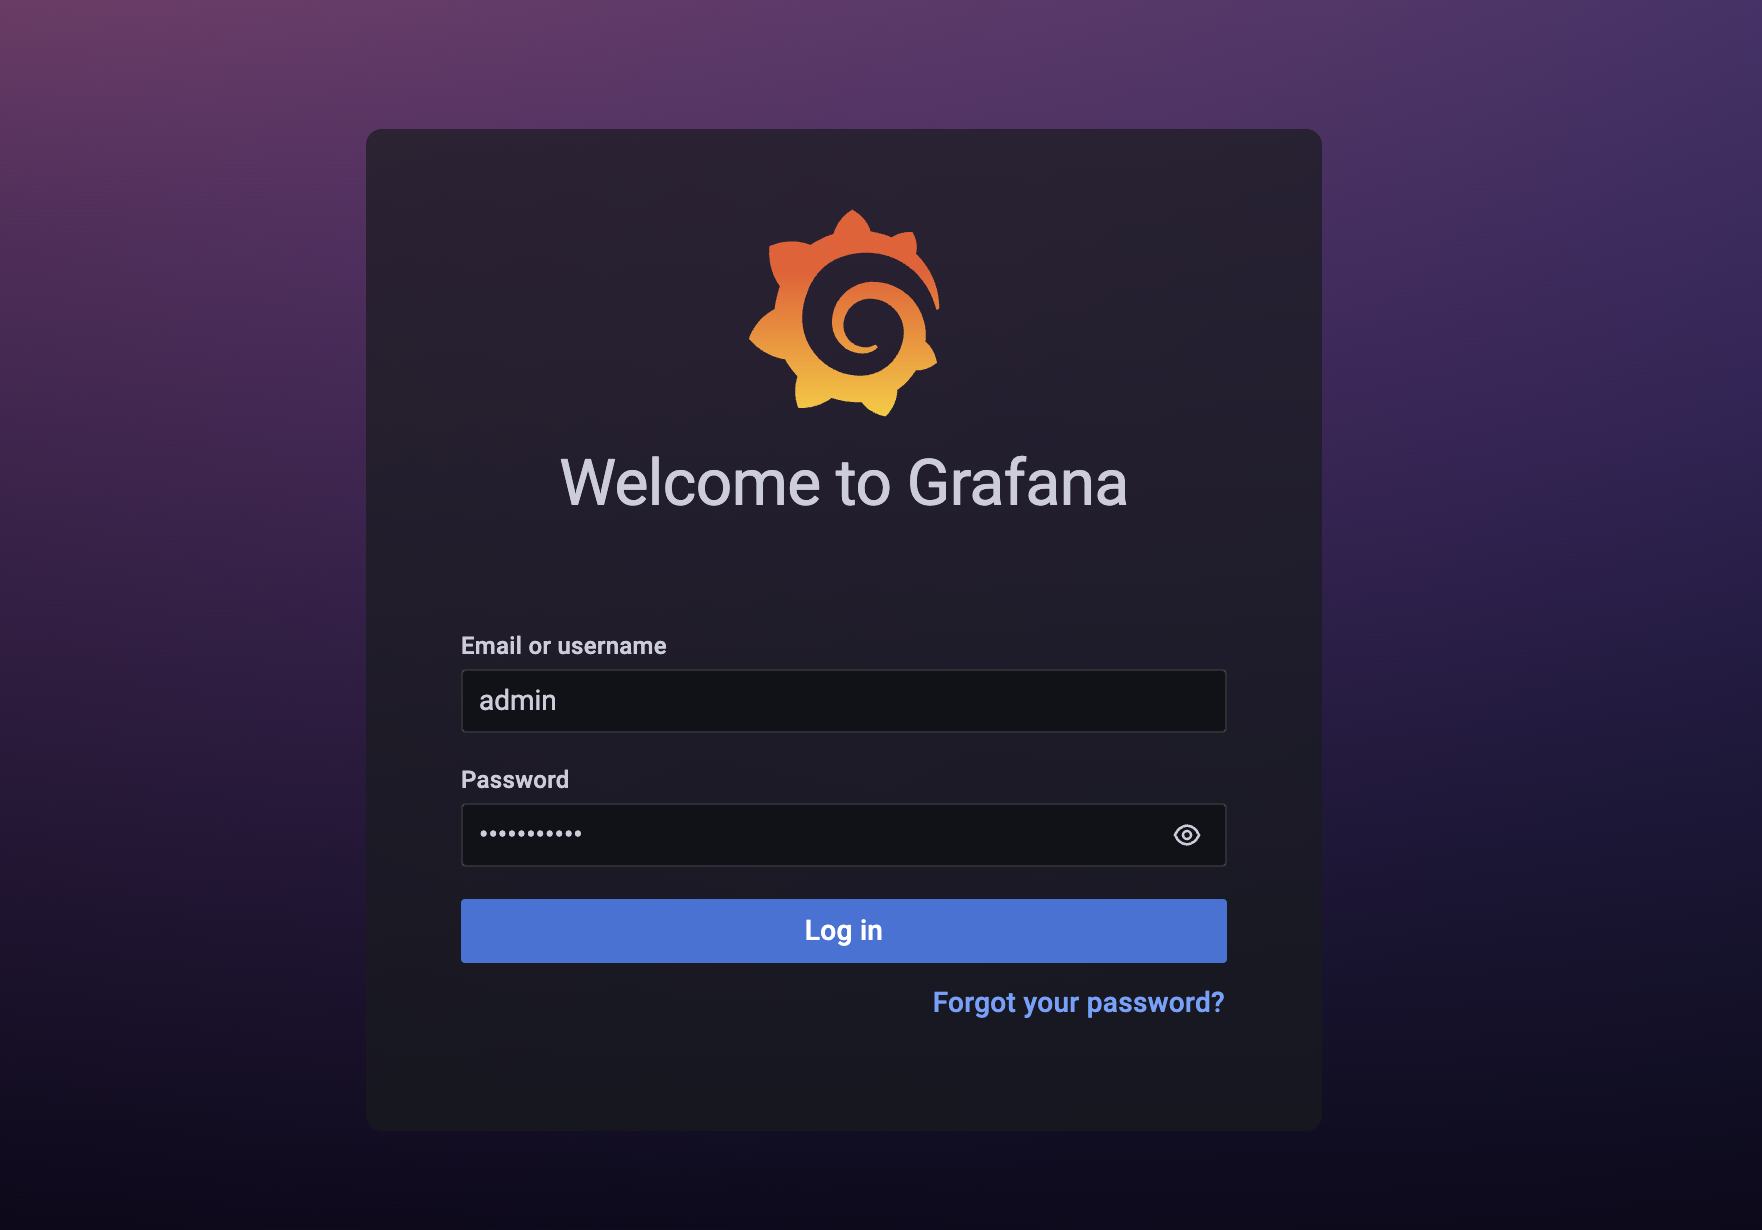
At the Grafana login page, login using your username and password:
- Grafana URL:
http://10.0.208.34:3000
- Username:
admin
- Password:
CiscoLive
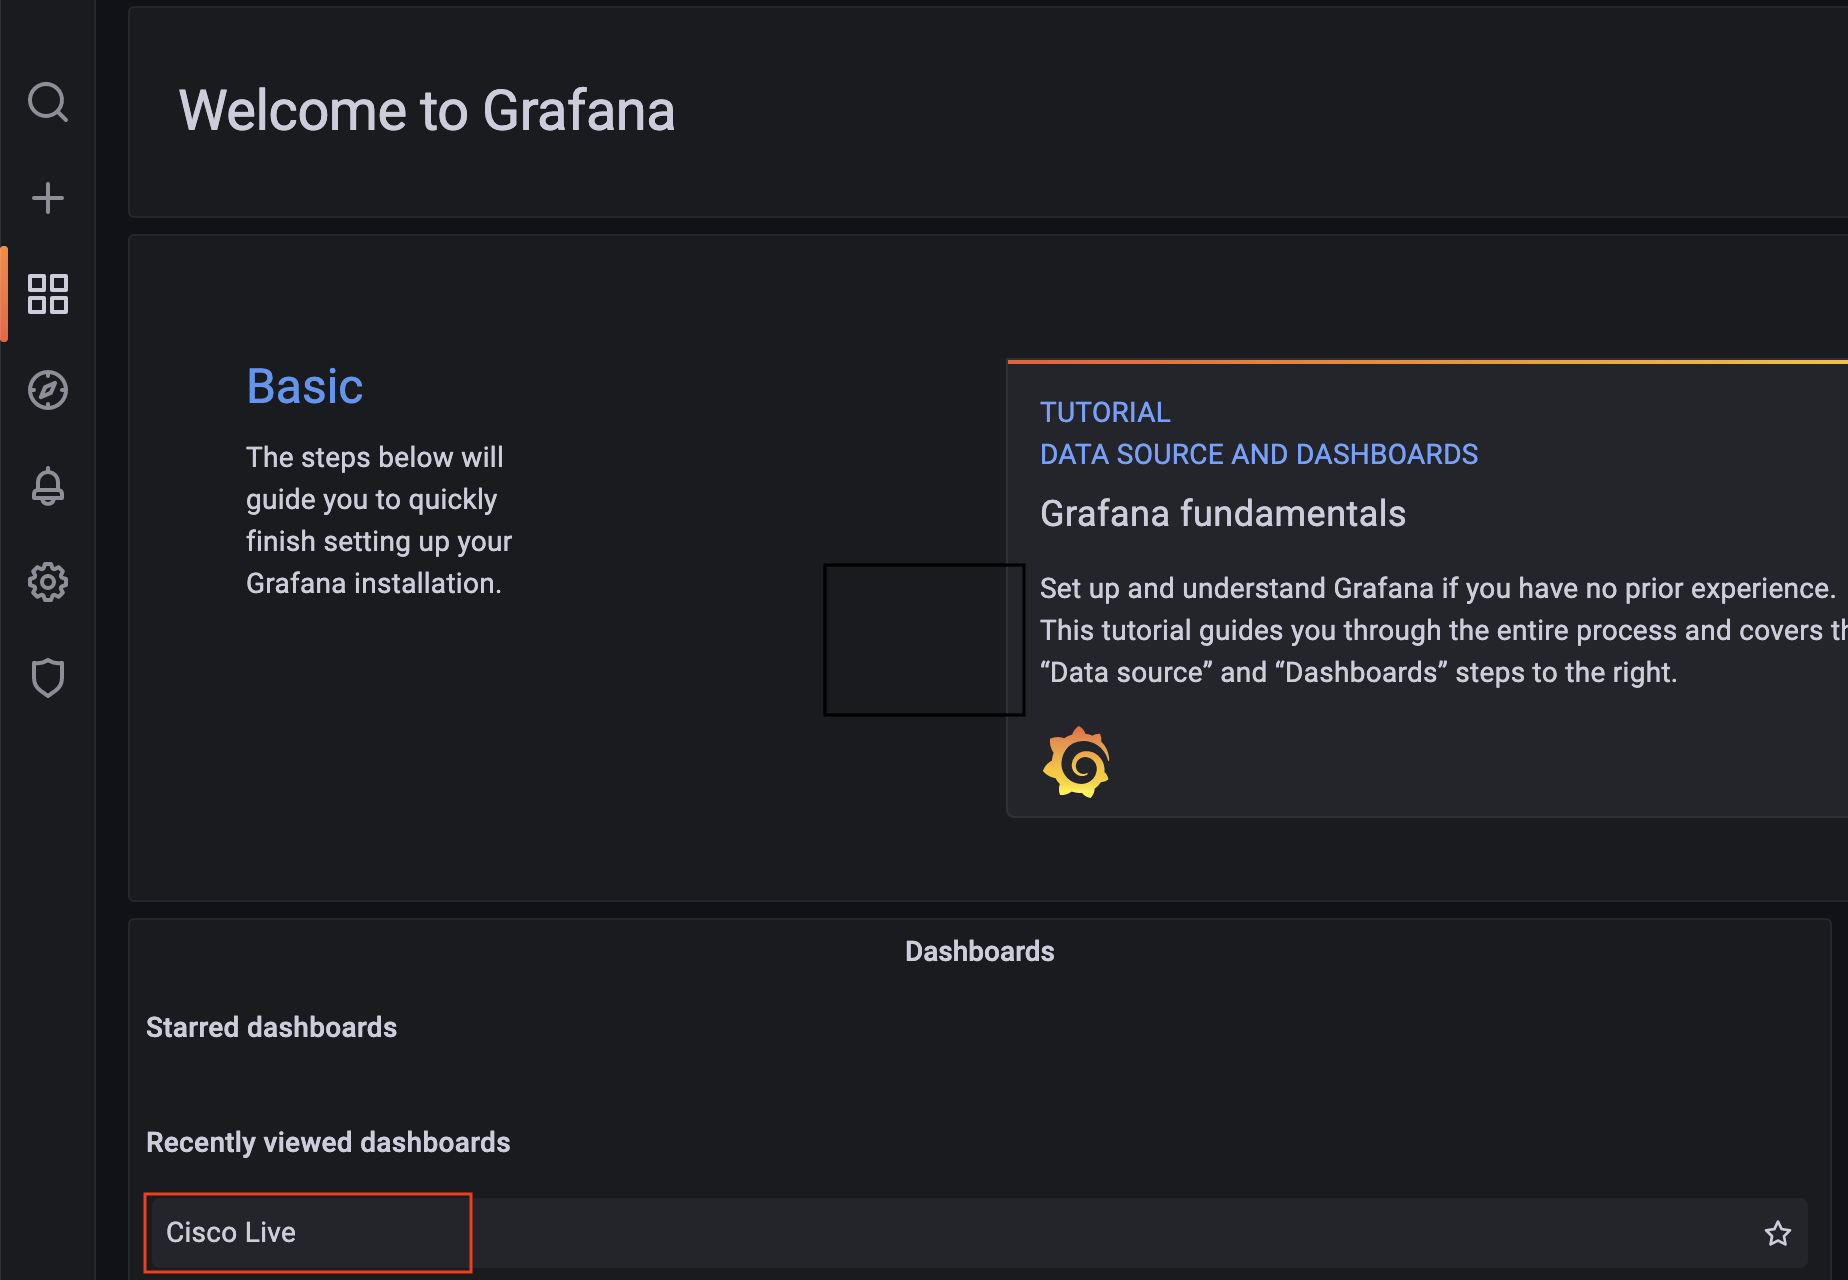
Step 2 - View installed dashboards
- Click Cisco Live
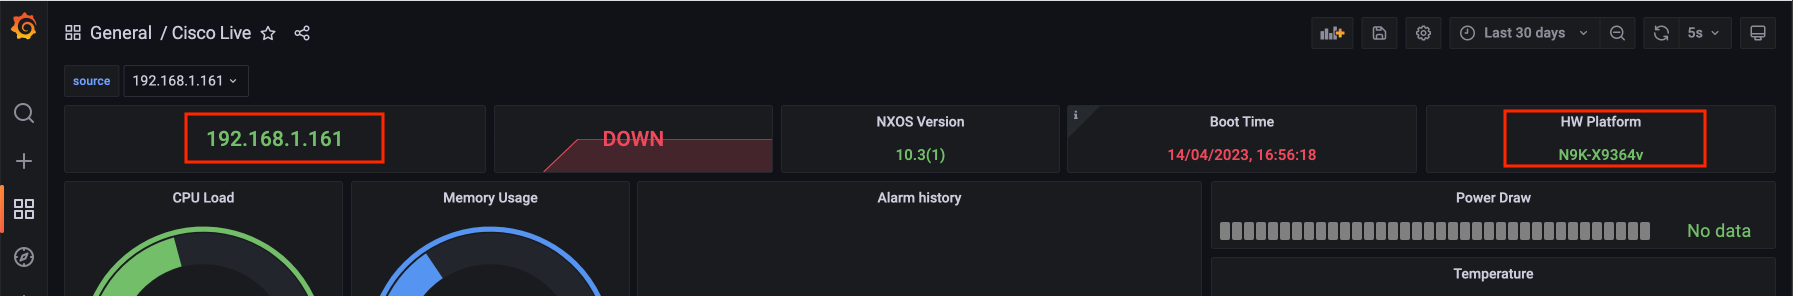
Step 3 - Confirm the Grafana dashboard is installed
Ensure that the highlighted sections are pulling data from InfluxDB. The IP address in your dashboard may be different
- Introduction
- Lab Environment and Topology
- Streaming Telemetry Overview
- Tools Overview
- TIG Stack
- Browse YANG Suite
- Bonus Task!
- Thanks