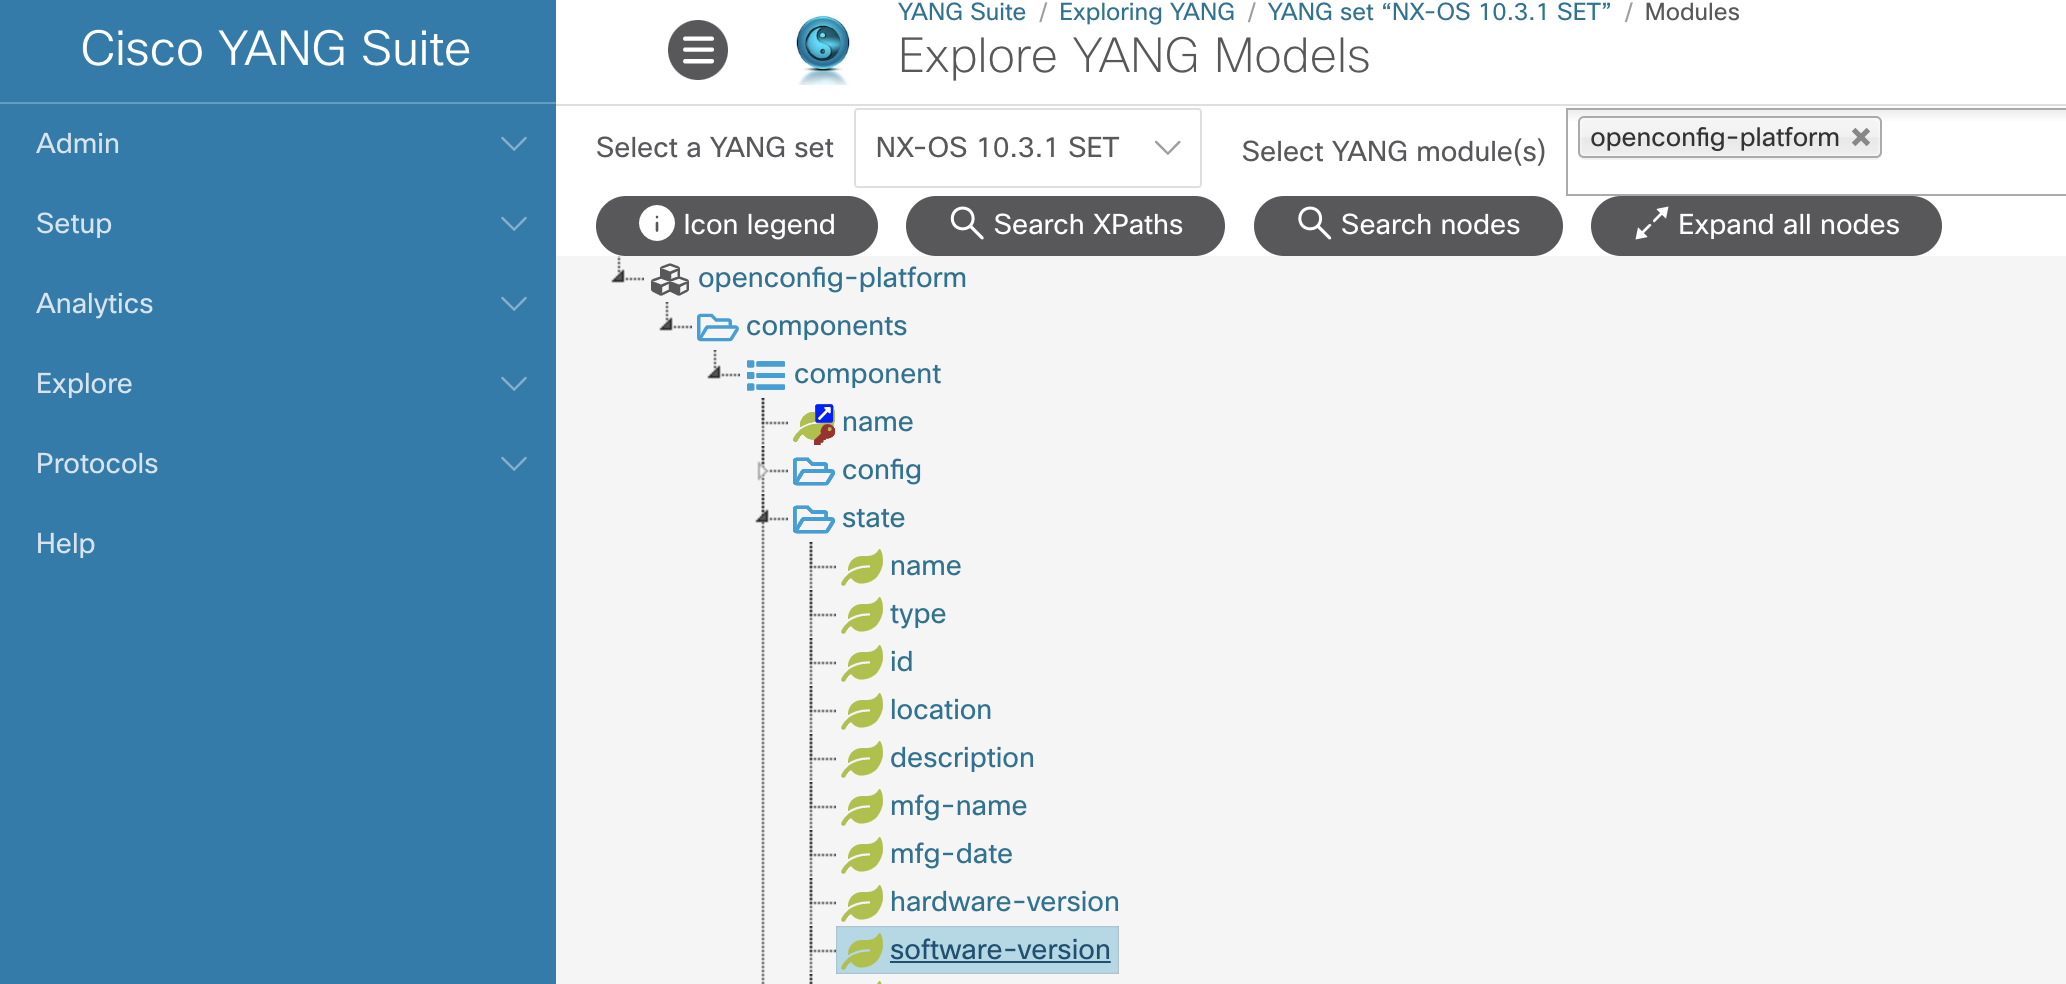
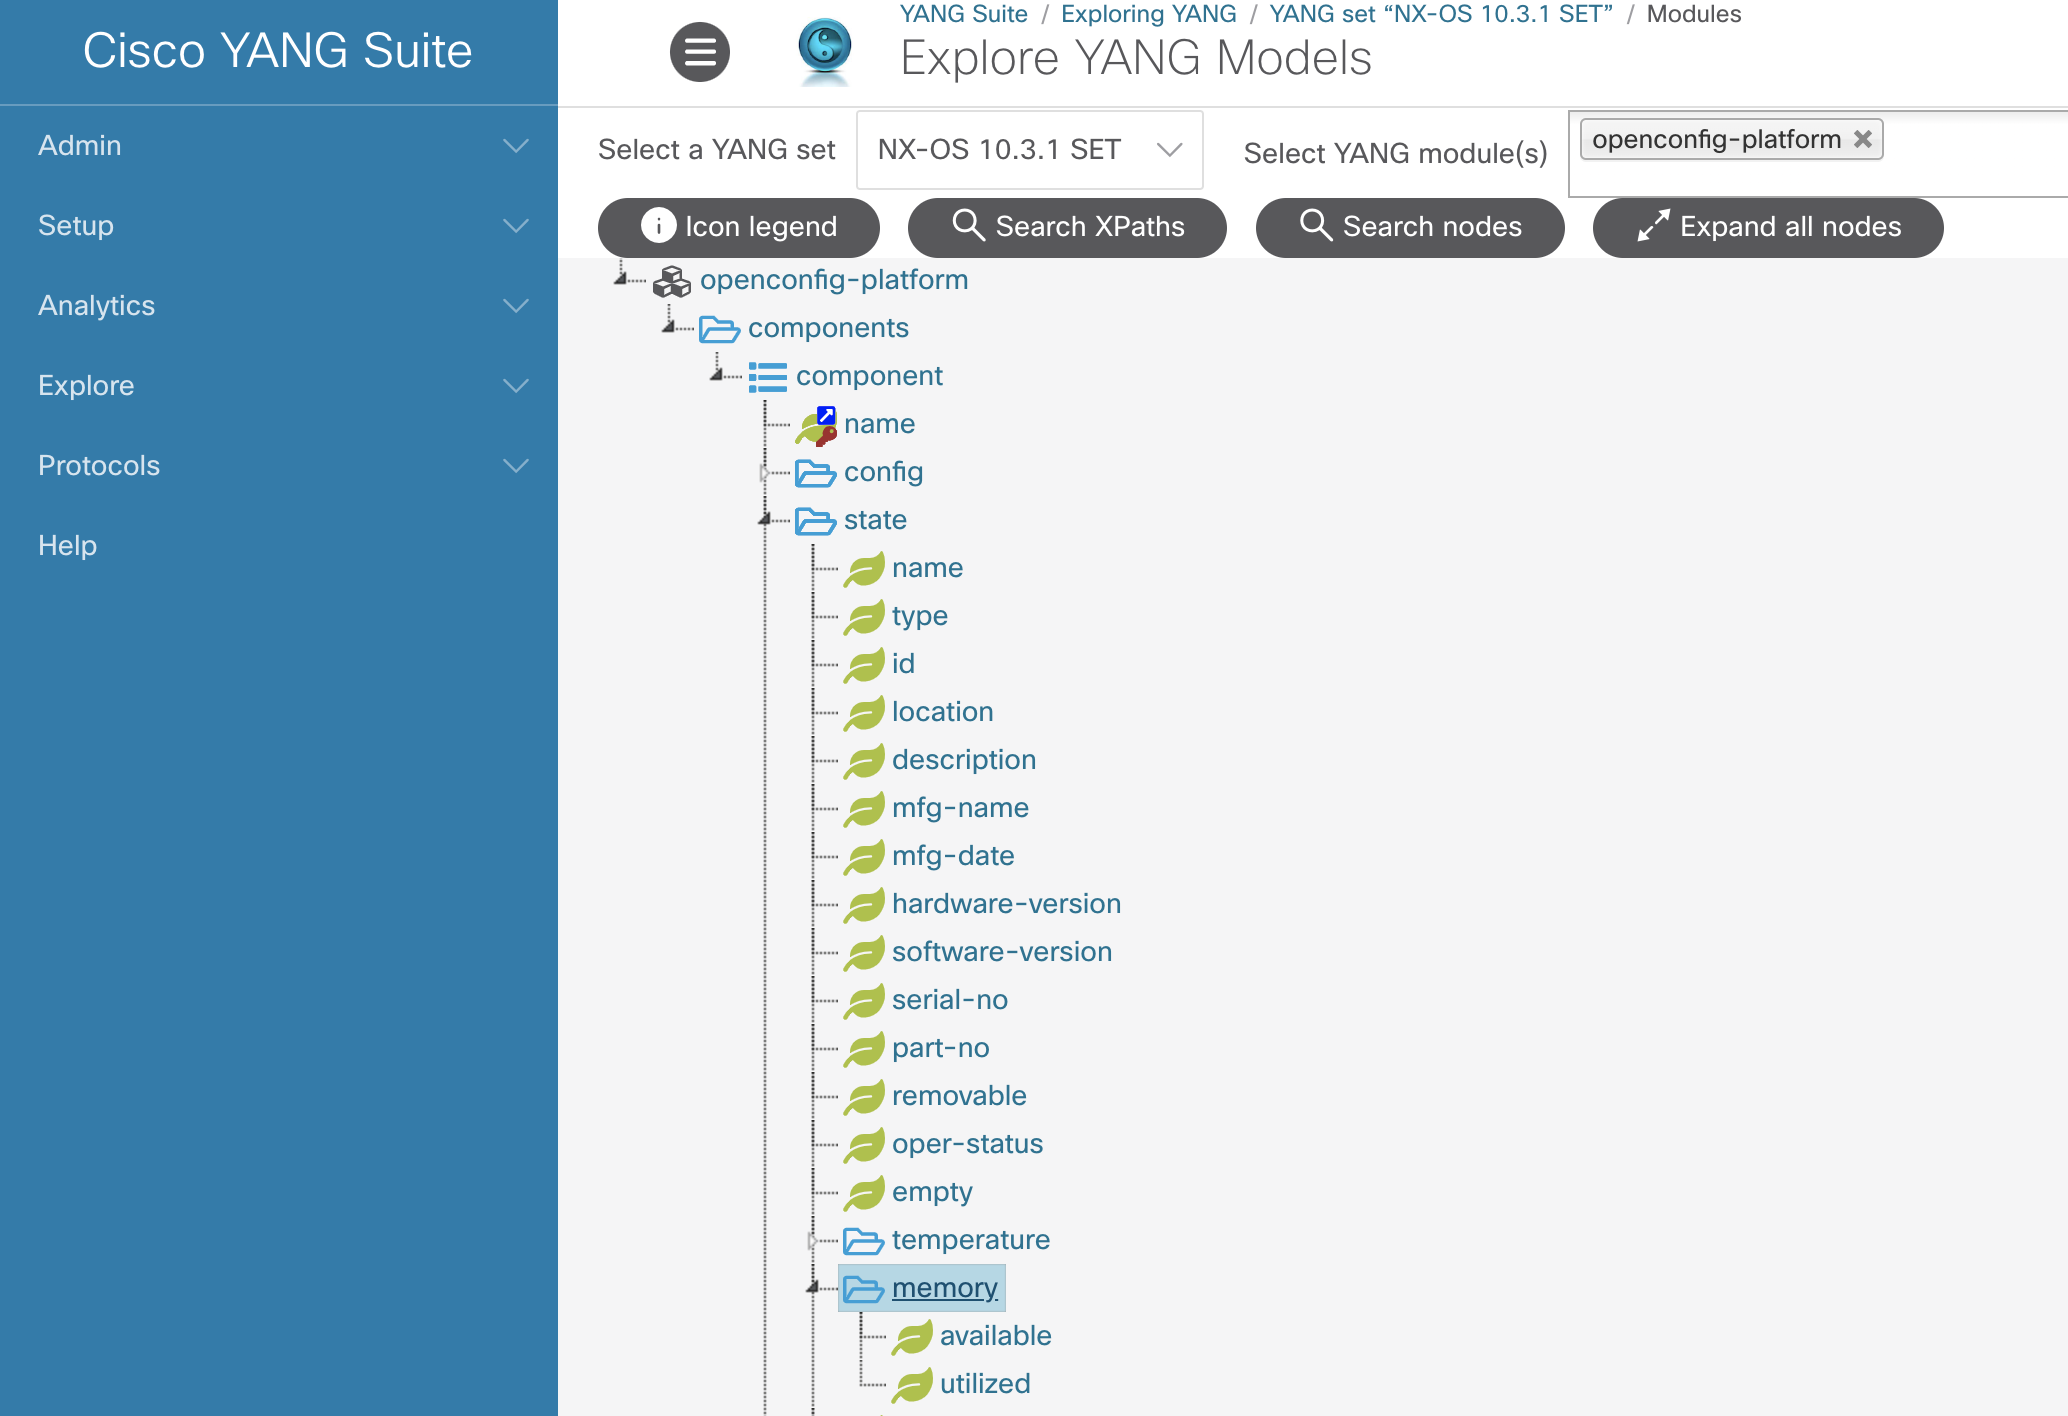
Platform specific data, can be defined as data that pertains to a single device, but that may not be relevant at a network level. This data can include the software version, the status of power-supplies, fans, CPU and memory utilisation amongst many other data point.
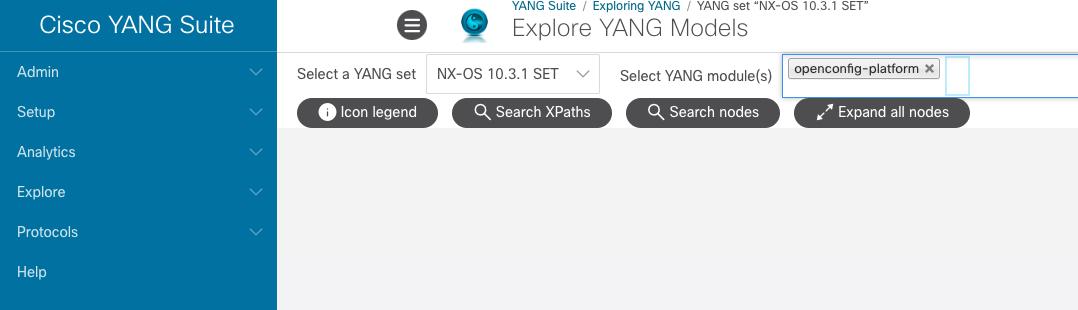
Within the openconfig-platform model, there are many relevant items that may be relevant on a per-device basis.
Stop all running containers by pressing Ctrl+c . We will restart these containers later with an updated gnmi.conf file.
Ctrl+C
Open file telegraf/gnmi.conf if it was closed previously
code -r /home/cisco/CiscoLive/DEVWKS-2135/telegraf/gnmi.conf
Replace the gnmi.conf file with the below content and press Ctrl+s to save the
file.
[agent]
logtarget = "file"
logfile = "/var/log/telegraf/telegraf.log"
debug = true
hostname = "telegraf"
interval = "10s"
round_interval = false
metric_batch_size = 1000
metric_buffer_limit = 10000
[[inputs.ping]]
urls = ["10.15.24.10", "10.15.24.11", "10.15.24.12"]
[inputs.ping.tags]
tag1 = "ping"
[[inputs.gnmi]]
# Address and port of the GNMI GRPC server
addresses = ["10.15.24.10:50051", "10.15.24.11:50051","10.15.24.12:50051"]
username = "admin"
password = "cisco.123"
## enable client-side TLS and define CA to authenticate the device
enable_tls = true
tls_ca = "/etc/telegraf/certs/gnmi.crt"
insecure_skip_verify = true
# redial in case of failures after
redial = "10s"
[inputs.gnmi.tags]
tag1 = "gnmi"
[[inputs.gnmi.subscription]]
name = "mgmt-ip"
origin = "openconfig"
path = "/interfaces/interface[name=mgmt0]/subinterfaces/subinterface/ipv4/addresses/address/config"
subscription_mode = "sample"
sample_interval = "600s"
[[inputs.gnmi.subscription]]
name = "platform"
origin = "openconfig"
path = "/components/component/state/name"
subscription_mode = "sample"
sample_interval = "30s"
[[inputs.gnmi.subscription]]
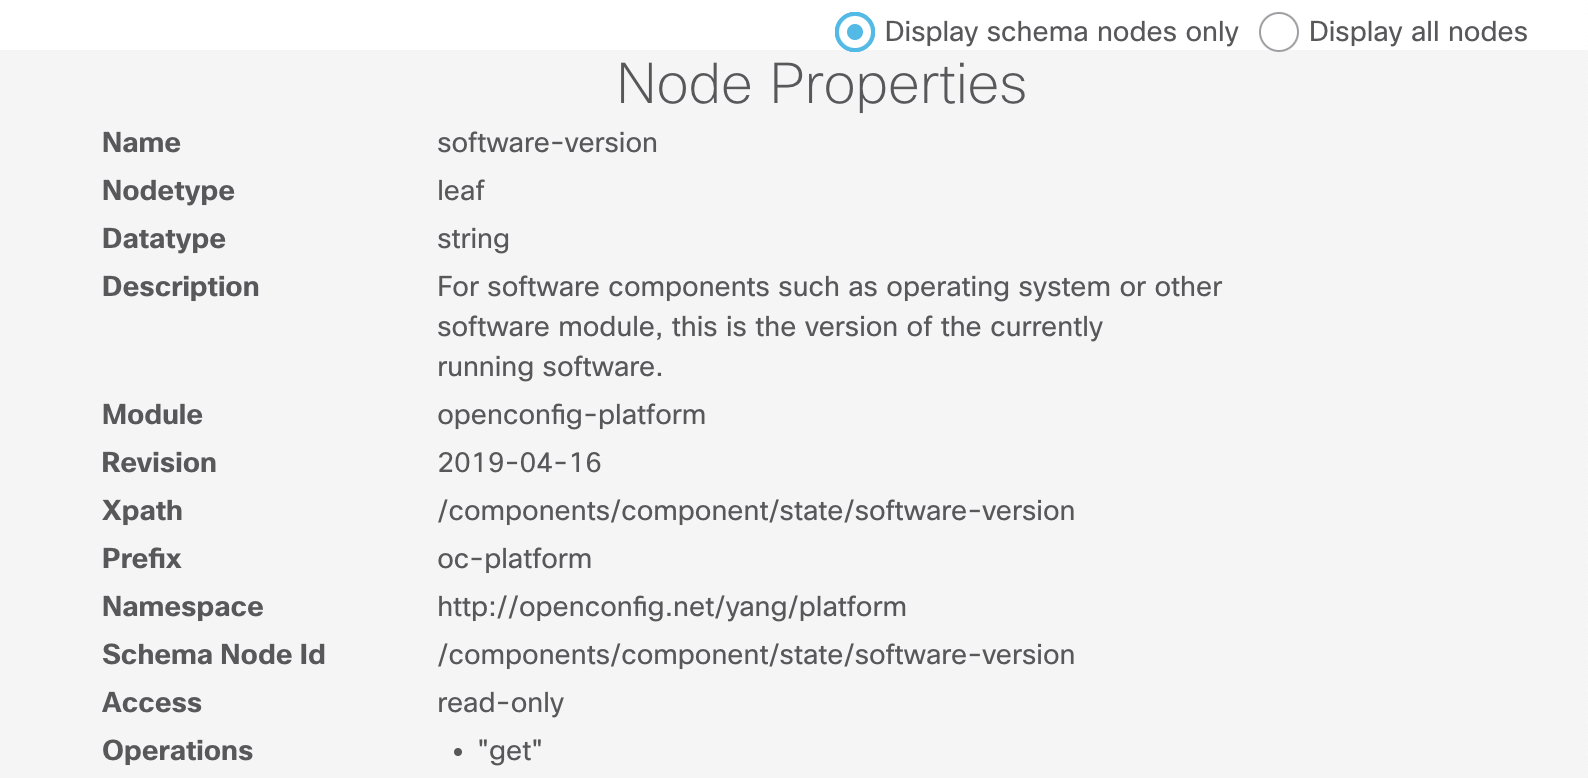
name = "software-version"
origin = "openconfig"
path = "/components/component/state/software-version"
subscription_mode = "sample"
sample_interval = "30s"
[[inputs.gnmi.subscription]]
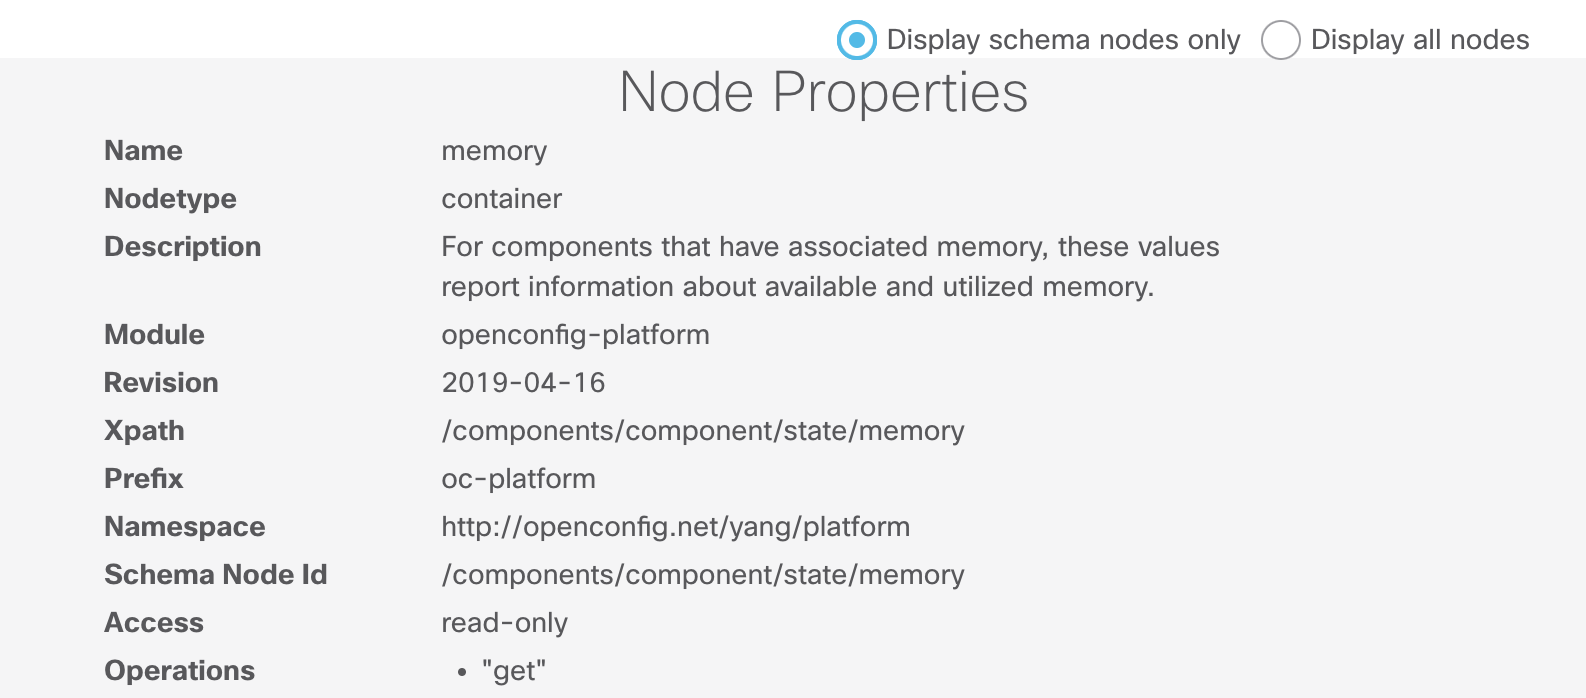
name = "memory"
origin = "openconfig"
path = "/components/component/state/memory"
subscription_mode = "sample"
sample_interval = "30s"
[[inputs.gnmi.subscription]]
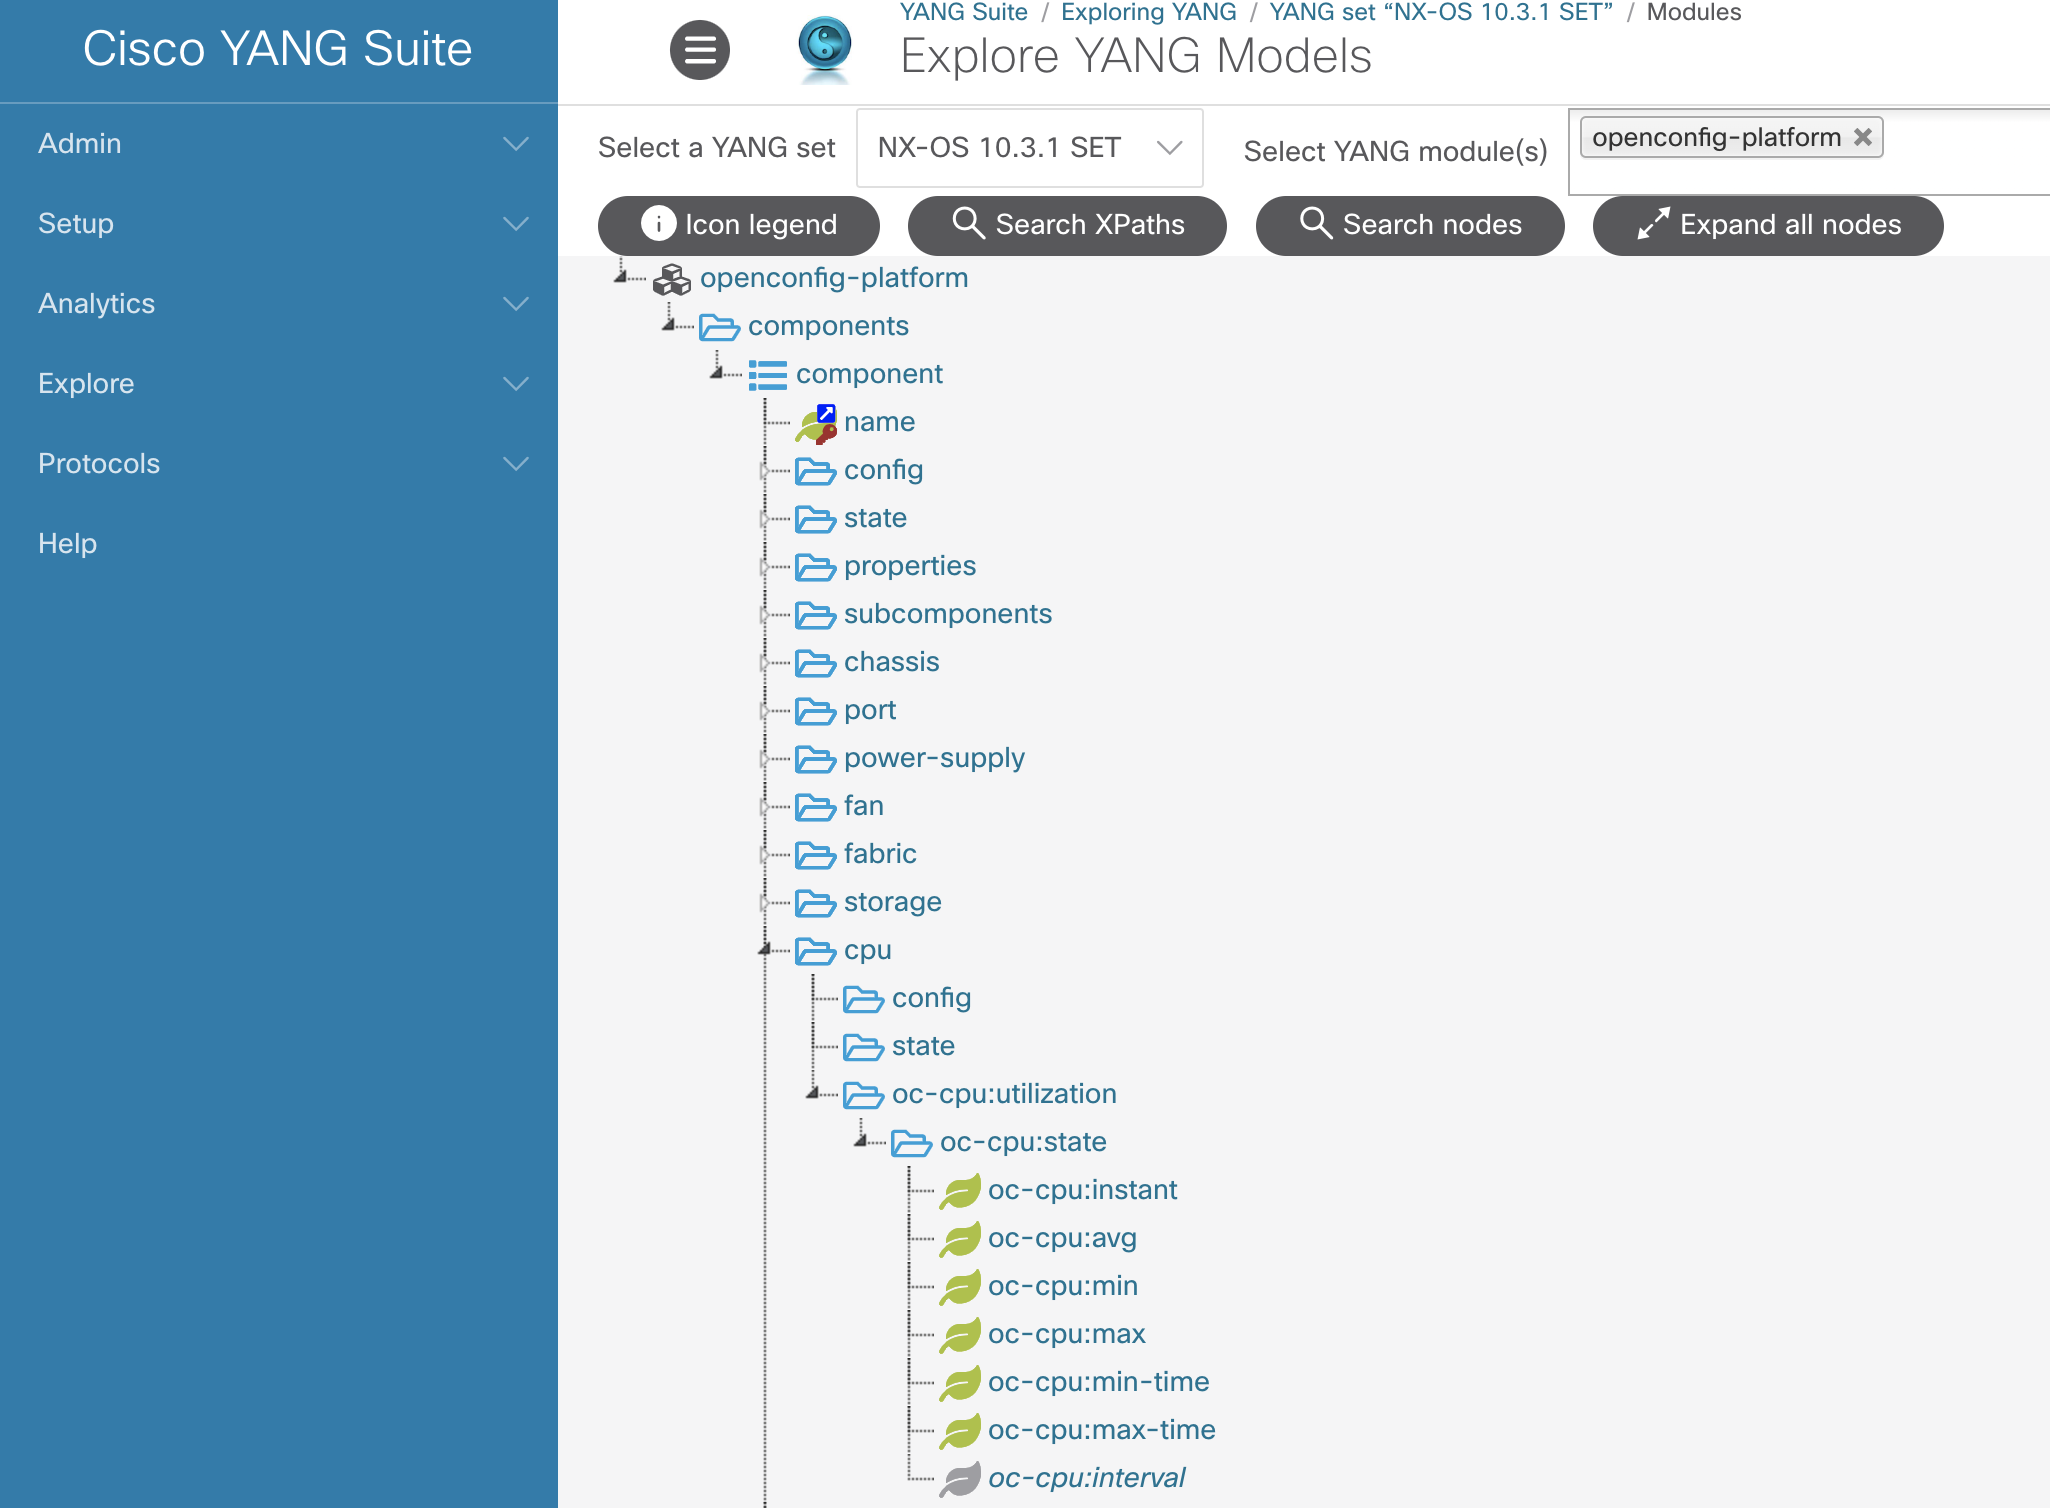
name = "cpu"
origin = "openconfig"
path = "/components/component/cpu/utilization"
subscription_mode = "sample"
sample_interval = "30s"
[[inputs.gnmi.subscription]]
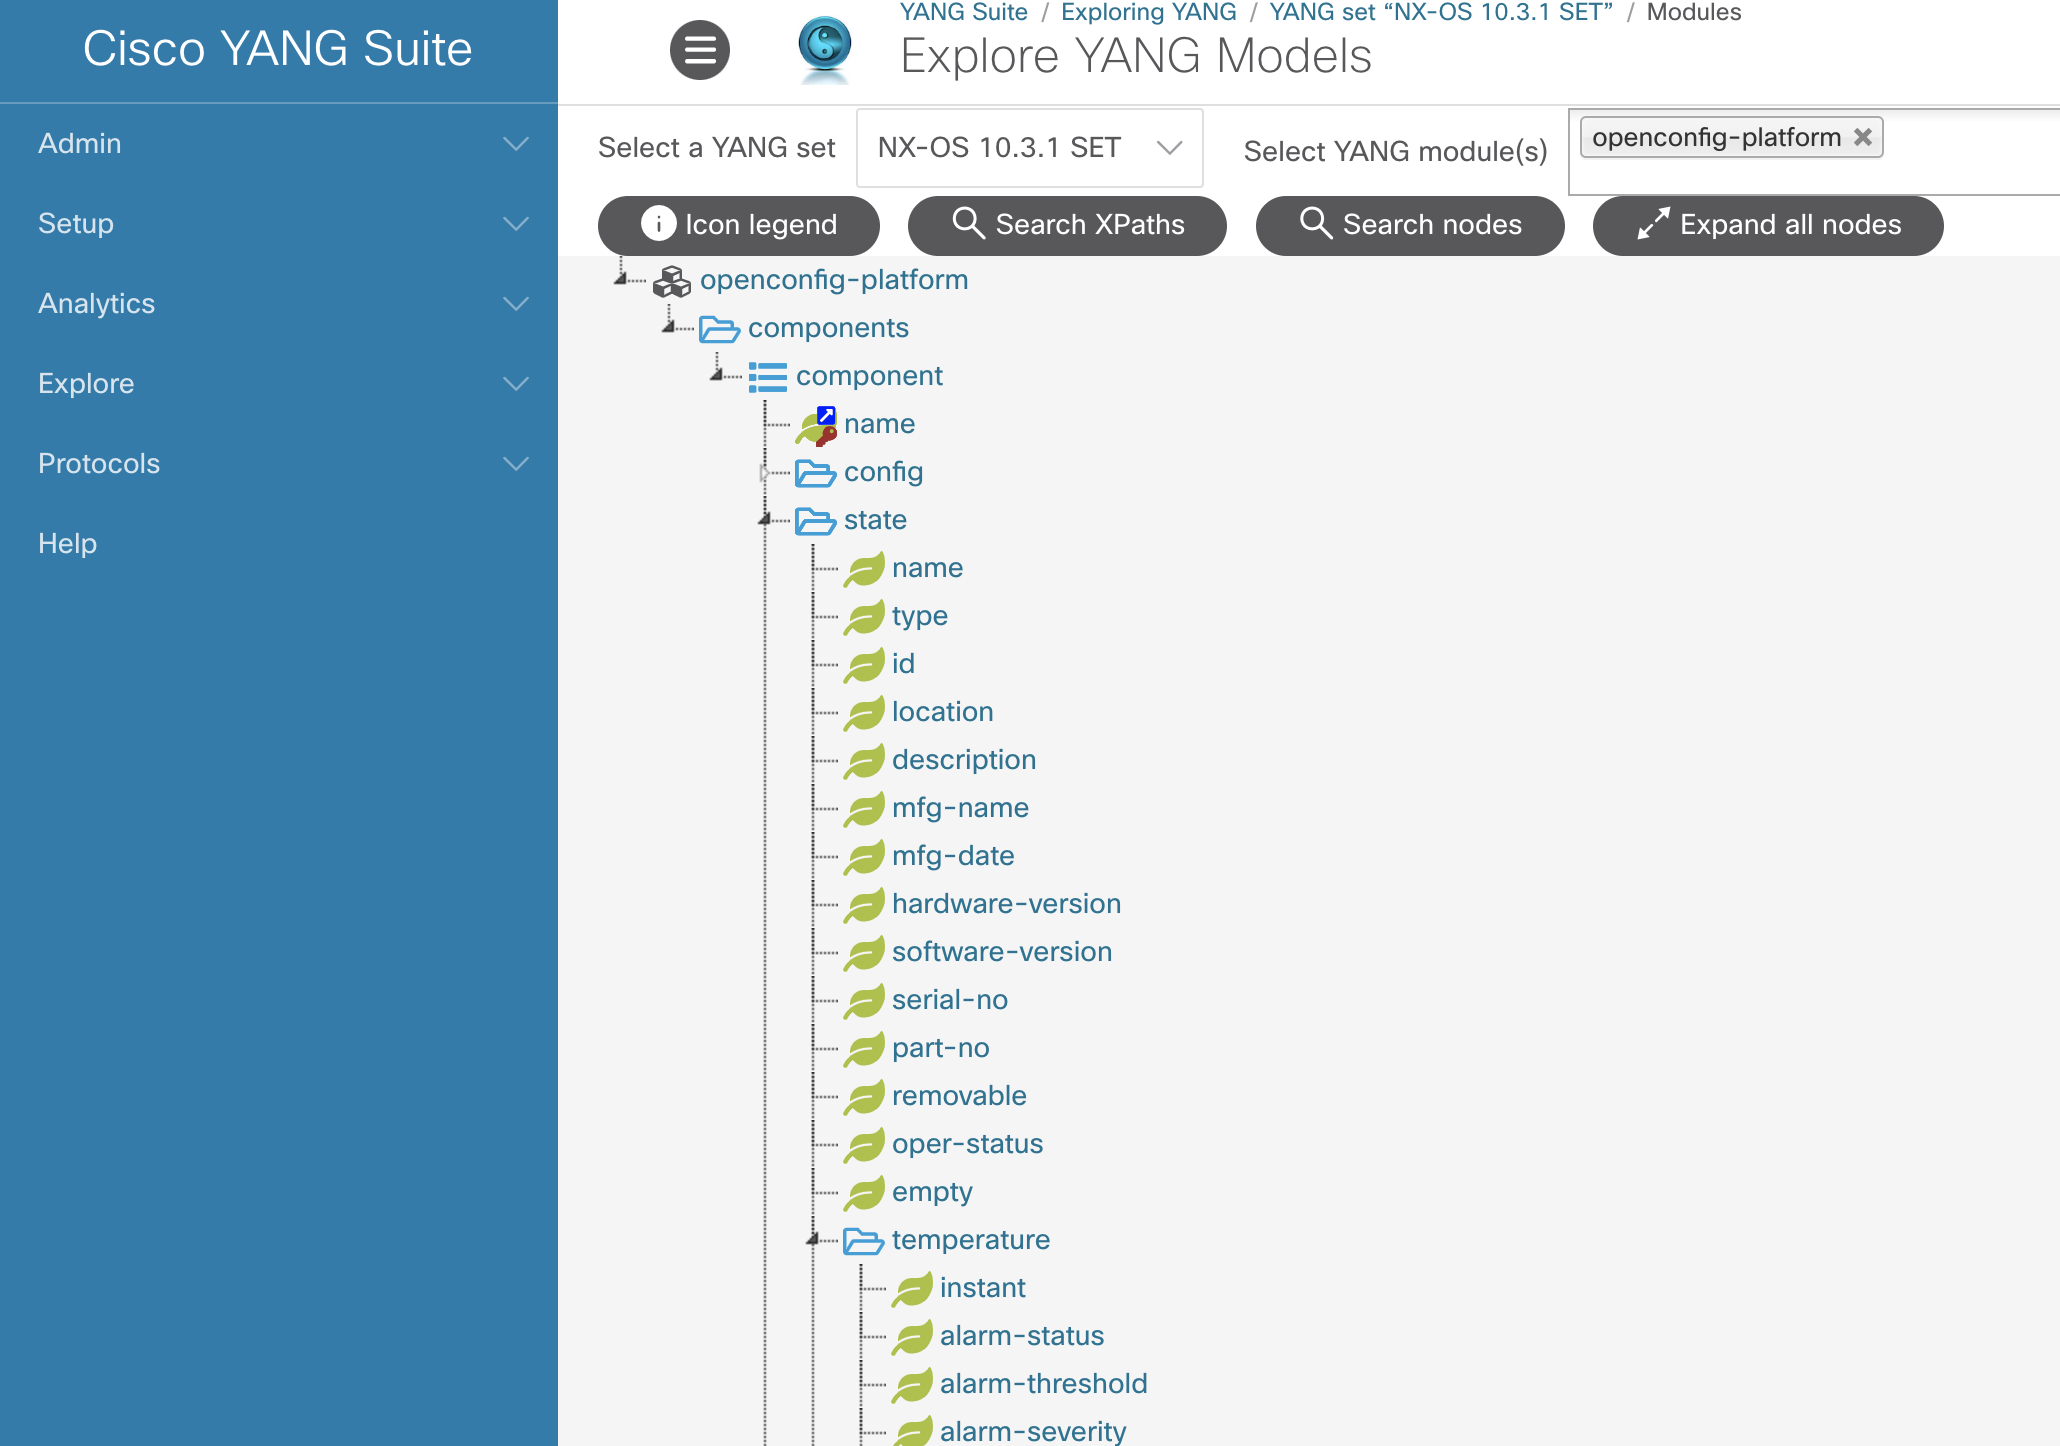
name = "temperature"
origin = "openconfig"
path = "/components/component/state/temperature/instant"
subscription_mode = "sample"
sample_interval = "20s"
[[inputs.gnmi.subscription]]
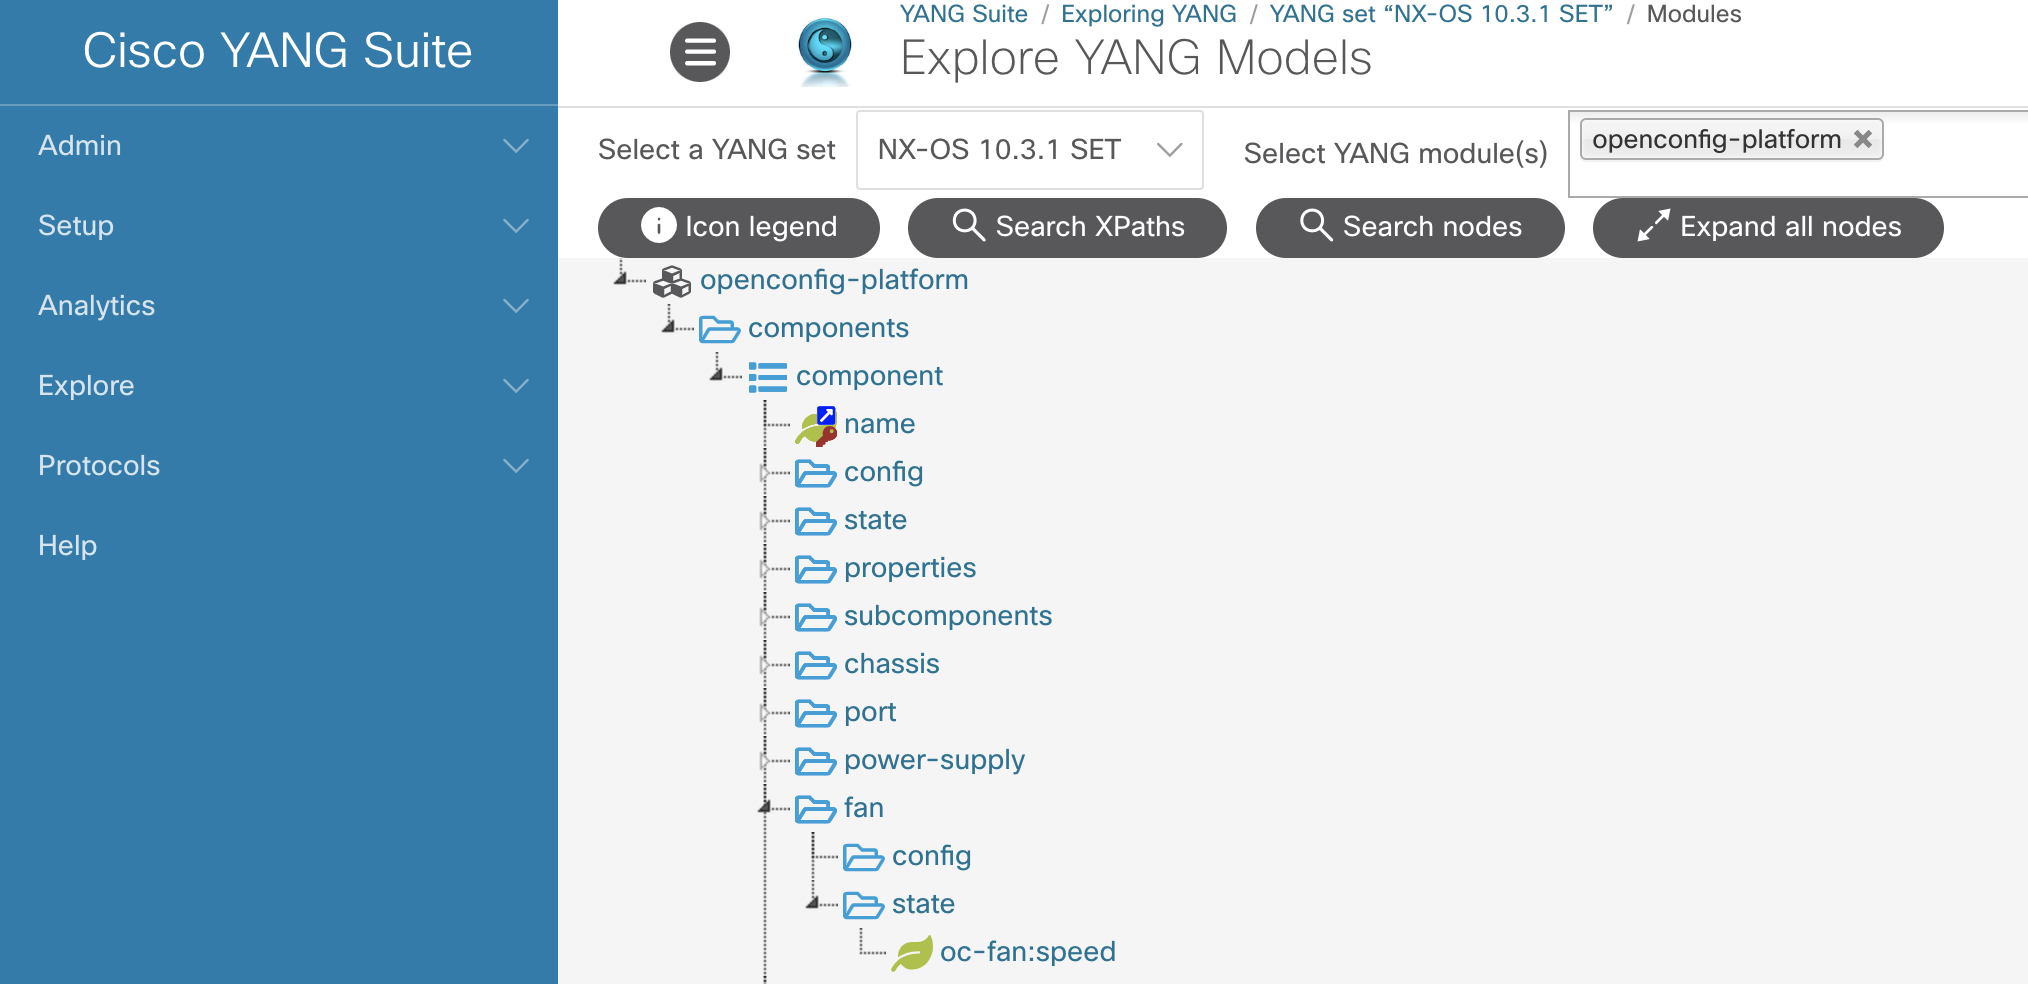
name = "fans"
origin = "openconfig"
path = "/components/component/fan/state"
subscription_mode = "sample"
sample_interval = "20s"
suppress_redundant = true
heartbeat_interval = "60s"
[[inputs.gnmi.subscription]]
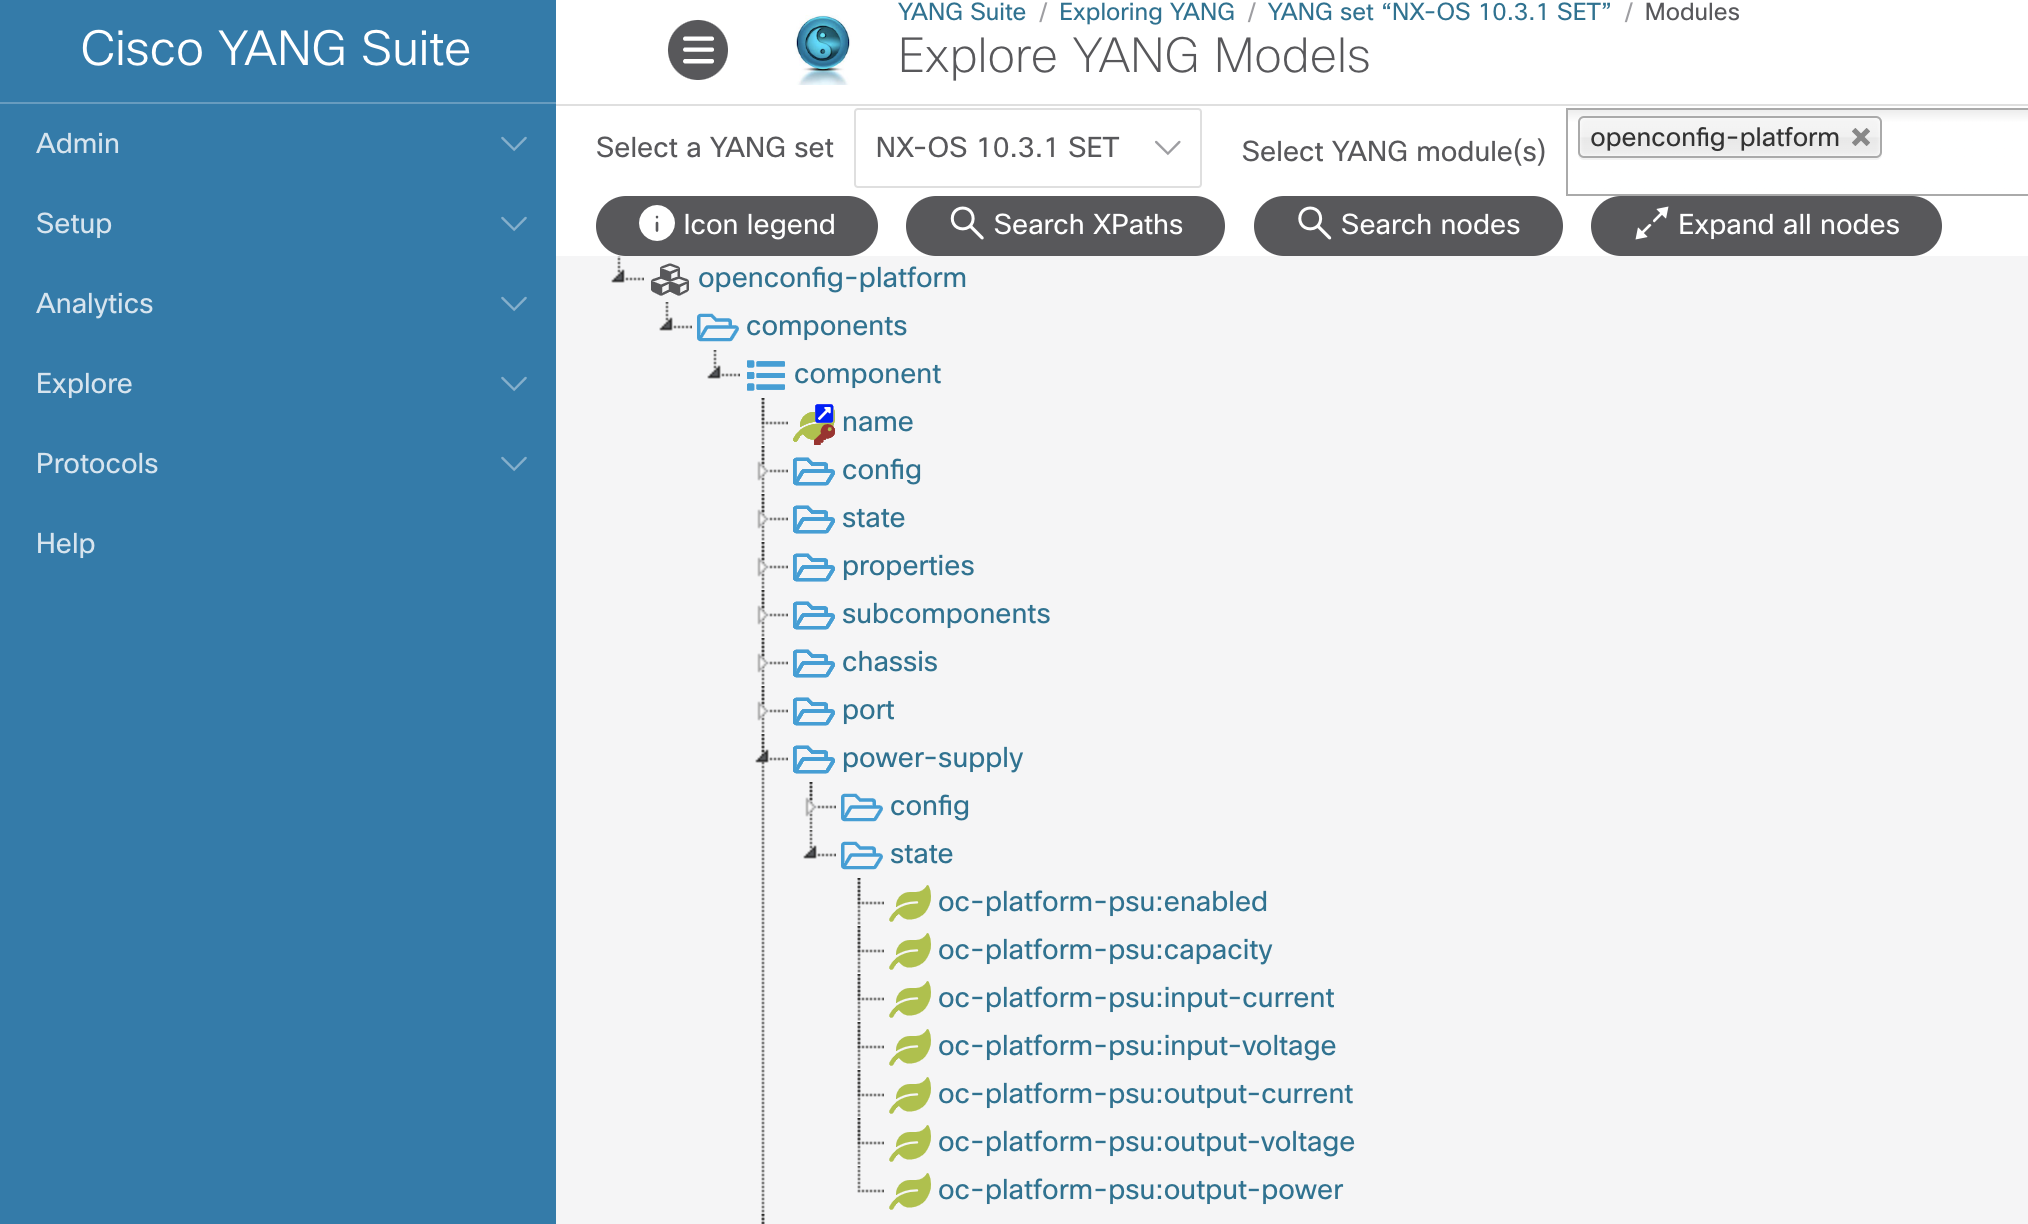
name = "power-supply"
origin = "openconfig"
path = "/components/component/power-supply/state/"
subscription_mode = "sample"
sample_interval = "20s"
suppress_redundant = true
heartbeat_interval = "60s"
[[inputs.gnmi.subscription]]
name = "boot-time"
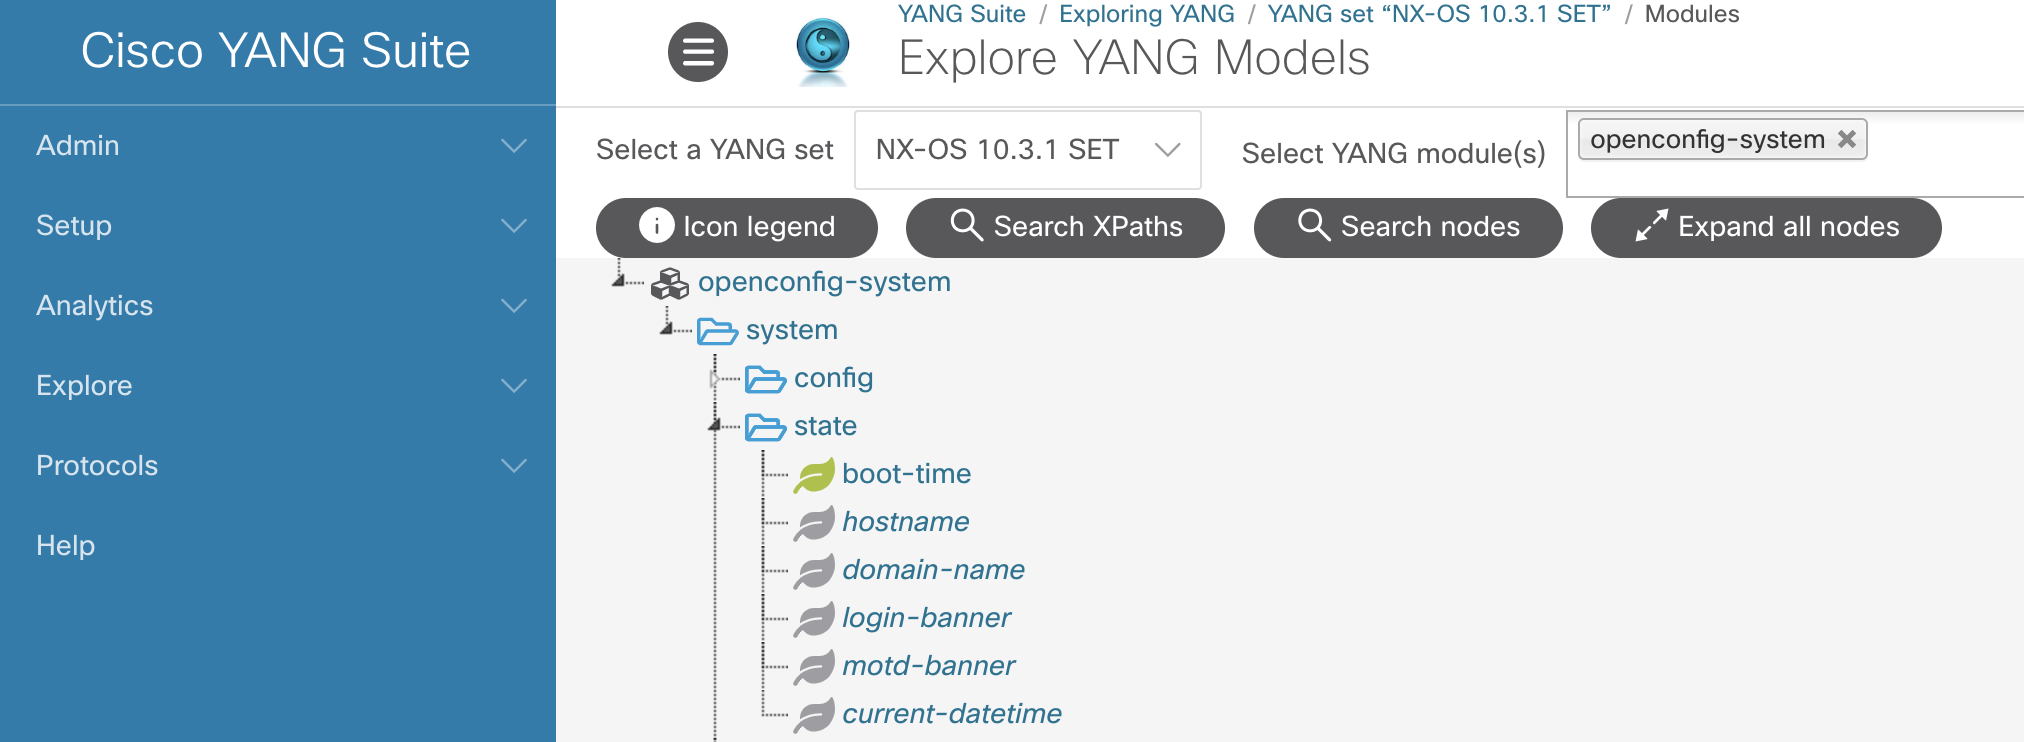
origin = "openconfig"
path = "/system/state"
subscription_mode = "sample"
sample_interval = "600s"
[[outputs.file]]
files = ["stdout"]
data_format = "json"
[[outputs.influxdb_v2]]
## The URLs of the InfluxDB cluster nodes.
urls = ["http://influxdb:8086"]
## API token for authentication.
token = "$DOCKER_INFLUXDB_INIT_ADMIN_TOKEN"
organization = "$DOCKER_INFLUXDB_INIT_ORG"
bucket = "$DOCKER_INFLUXDB_INIT_BUCKET"
[outputs.influxdb_v2.tagpass]
tag1 = ["gnmi", "ping"]
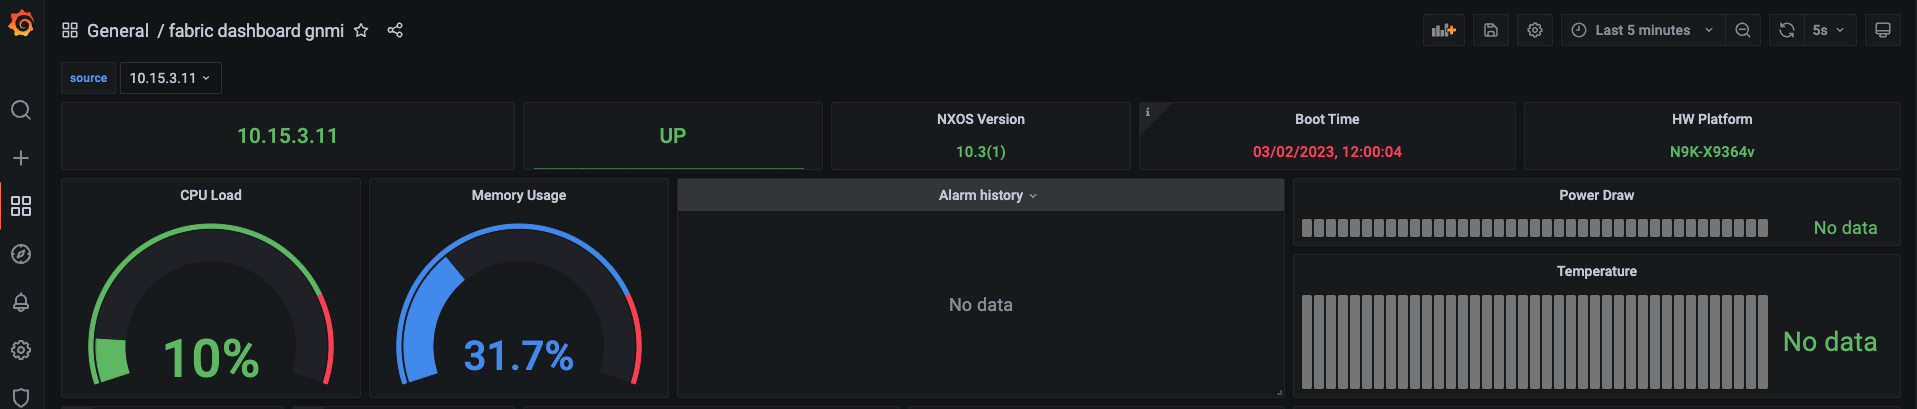
Run the
docker-compose.yml file via the below command. Confirm that the subscriptions establish to the switches and the data is outputed to the terminal and the data should now also be present in Grafana.
docker-compose up
Now browse to the Grafana dashboard and hopefully the information from the paths we just added will appear on the dashboard.